Manage the cost of Javascript
Today I’m gonna share how to manage the cost of Javascript. I divided into five parts as below:
- How browser works
- What is the cost of Javascript
- Performance Budget
- Experiment Performance Budget with my own project
This article would be relatively long, but please bear with me, I believe you’ll get something useful.
How browser works
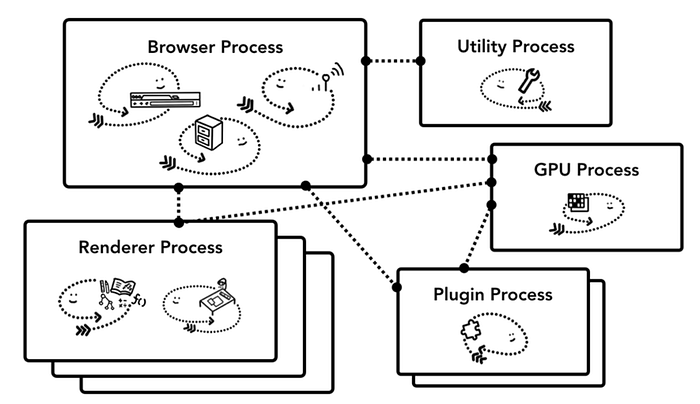
To begin with, the “browser” I’m referring to today taking chrome as an example, although different browsers have their own nuance on implementation details, they share similar ideas. As the image below, inside browser, there are different processes working together. There is one browser process which handling things like top bar, url address bar, backward/forward button…so on and so forth, and also communicate with other processes like sending network requests. As for each tab, there is one renderer process dealing with how website displays.
Let’s zoom in to the Renderer process:

Inside renderer process, there are different threads cooperating together along the way of rendering. Main thread is the one which handles main sorts of tasks such as parsing HTML, parsing CSS, parsing & compile Javascript and even the execution of Javascript (i.e rendering pipeline). Although other threads also help on tasks like composite and raster, if you have too heavy tasks to be done in the main thread, it’ll block your rendering pipeline and prevent bringing your website contents to users smoothly, which is referred to as blocking main thread.
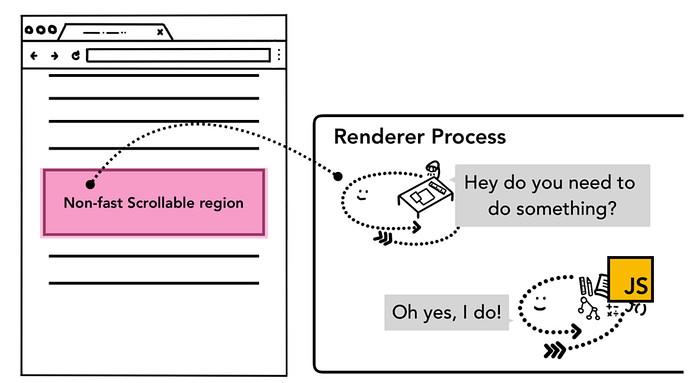
Besides, when users initially load your website, if some elements are registered with event handler (e.g onclick), they’ll be marked as “Non-fast Scrollable region” and if users interact with those elements (e.g click a button), the event will be passed to main thread to execute corresponding callback. However, if at the moment your main thread is busy on something else (e.g parsing or execute Javascript), the main thread will queue the event until it becomes idle again!
Ok, here we got the rough idea of how browser works, let’s move on!
What does it mean by the cost of Javascript?
This idea actually comes from this article written by Addy Osmani. Nowadays, we have more and more JS-heavy websites or you call it Single Page Application (SPA), which indeed increases the websites’ interactivity and create rich user experience. However, we pay our price for it. Huge sizes of Javascript might come with negative impact on web performance.
You might ask “Why we blame Javascript so hard?” while there are also other tasks being done along the rendering pipeline like parsing HTML/CSS, loading image…so on and so forth. Let’s take below image as an example:

As you can see, although both Javascript and Image files share the same sizes as 170 KB, there are big difference on resource processing time.
There are few reasons:
- Javascript is compressed before serving to the browser, which means the actual size required to be processed are way bigger than that.
- Not only just load it, Javascript also needs to be parsed, compiled and executed.
Basically, there are three types of costs involved:
- Cost to load Javascript files through network, especially with slower one.
- Cost to parse, compile and execute the Javascript, which happens in main thread.
- Cost of memory consumed by Javascript, which may make your page look laggy if it’s too much.
Time to Interactive (TTI)
I also want to bring up this term because it’s highly related to how users perceive your website as fast or slow. The definition used by Google is as below:
The Time to Interactive (TTI) metric measures how long it takes a page to become interactive.
Namely, when the user visits your page, see a button being rendered, and click it, how long your website takes to respond to this click event. Take the website of Mercari as an example:
If we test it with fast network and good CPU processing powers:
Here are the profile result and summary graphs:


As you can see, once I clicked top left tab, the next page is navigated immediately. Within the profile graph, when “Tap” interaction happened, “Main” thread has plenty of idle time, which can be used to respond to the user interaction right away (66.62ms).
However, if I tested with “fast 3G” and “4x slower” CPU:
Profile result and summary graphs:

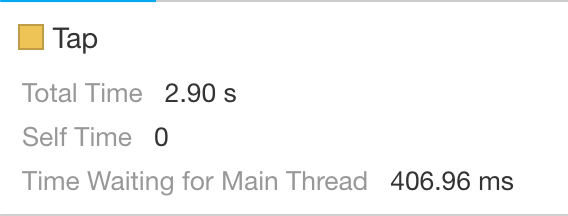
Even though I clicked the same tab multiple times, it didn’t have any response. By looking at profiling result, you can see while Tap event happened under Interaction timeline, Main thread is actually packed with tasks such as Parse HTML and Evaluate Script, which slows down the response time to 2.90s 😅.
Anyway, those experiments pinpointed what we can improve:
Our Javascript should go on a diet!
Performance Budget
Next, I’d like to bring up a concept called “Performance Budget”, if you want to trace the original sources where this idea came from, please check these two articles: Can You Afford It written by Alex Russell and The Cost of Javascript written by Addy Osmani. To my understanding, rather than being a new buzz word used among frontend development, the concept of Performance Budget is more like a good mindset as a developer. I can summarize it with my own words as below:
- Performance budget is a metric to manage the cost of Javascript such as Javascript bundle size and Time to Interactive (TTI).
- It’s not a one-time task. Set the budget and integrate with your CI process to monitor the performance and prevent the regression.
- When making decisions of your product, keep this budget in mind.
Those three points are my thoughts on Performance Budget, and more than that I came up with another metaphor while writing this article. Imagine you’re determined to go on a diet, and it’s better to set a “target weight” first, right? Let’s say 70 kg. And what if there is a wearable device with a service which will check your current kilo after you finish a meal or done your workout? Don’t you feel like if that happens, it’s really easy to keep track of your goal and even when you reach the goal, on the purpose of not being fat again, you can easily monitor the target number with this service. That’s the idea of performance budget. If you think it’s shitty metaphor, I apologize, please continue reading.
In order to put it into reality, I first experimented with my own project, the last part of this article!
Experiment Performance Budget on my project
As said, I’m gonna demonstrate how I integrate the concept of Performance Budget into my project.
To begin with, here is the initial page of my web app:

At the initial loading, this page will fetch a dashboard.js from server, which handles the interaction such as showing the menu while clicking the top left hamburger icon.

If you are a bad and careless engineer (like me🙄), you might accidentally make you initial Javascript file as big as 510KB! It can’t be right, and I want my Javascript to go on a diet, NOW!
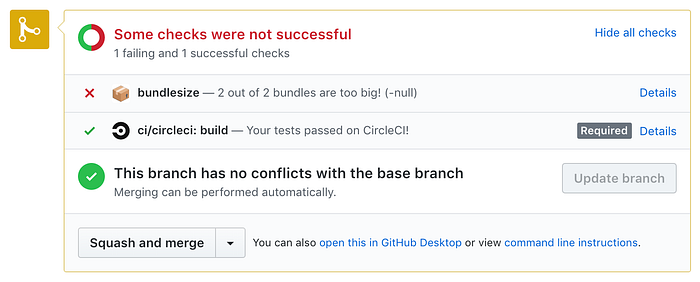
At first, I have to set a performance budget to monitor my progress before & after improvement. I took advantage of the npm package bundlesize and integrated with my CircleCI build process and github pull request check.
Add bundle size dependency, configuration and testing scripts:

I set the maxSize to be 170KB. This numbers came with some rough math, and if you’re interested, please check this article: Can I Afford It.
Here you can see how yarn size is run to check with our maxSize :

And the result will be reported to our github pull request check:
Okay, got the tool setup, let’s take advantage of some recipes to lose some weight from our Javascript:
Code Splitting
Code splitting is to send minimal code required for current page, there are multiple ways to do it, if you’re interested in this technique, you can dig into this great article. For experimenting, I just dynamically import my components which are not being used in this page as below:

With few lines of change, the bundle size decreased to around 305KB:


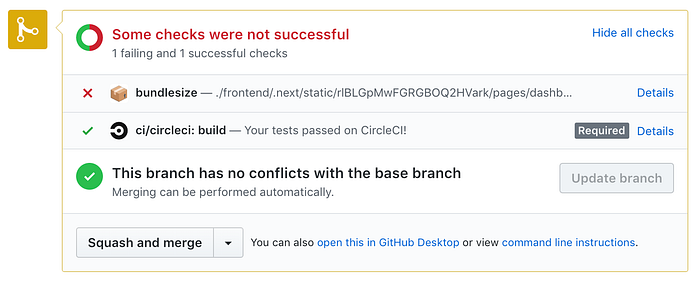
Although it still didn’t pass my performance budget (170KB) but not bad huh? Now my user might be 40% happier while visiting the website, but we can do more.
Tree Shaking
Tree shaking basically just eliminated unused code while compiling your code, here is also a good reference article if you want to learn more about tree shaking techniques.
In my case, I first detected where my unused code locates with Coverage Tab of Chrome Dev Tool as below:

Red color indicates how many lines are not being used for the current page. It seems there are a lot of unused code in my dashboard.js . By looking at the other panel, you can get into dashboard.js to check the details;

Based on the summary graph here, I realized the npm package moment.js included many unused code for me. Due to the fact that I only need limited functionalities to format my date, I decided to replace moment.js with date-fns, which is a more lightweight date utility library:
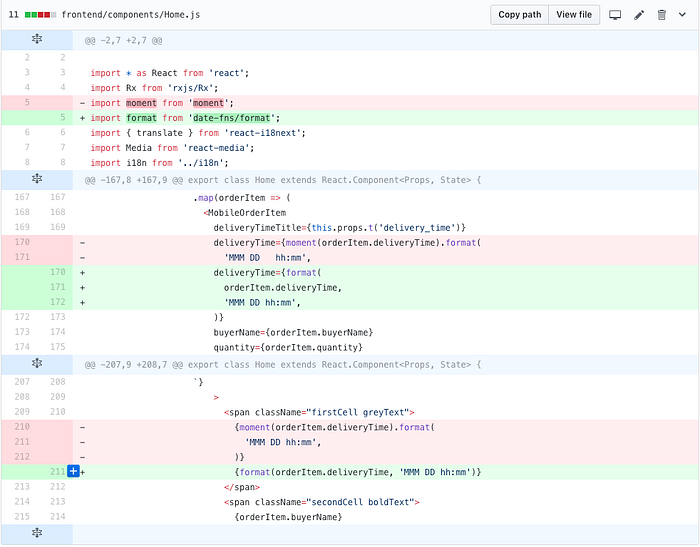
After that, I checked the Coverage analysis again:

As you can see, the ratio of unused code is dramatically dropping and decreasing the size of dashboard.js .
Then, stage, commit and … wait for it … :

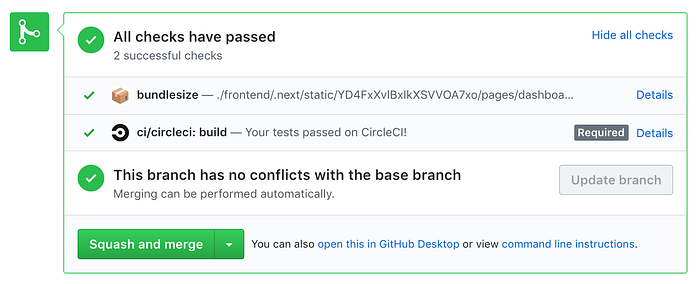
Finally it passed! My Javascript bundle size reached the Performance Budget I set. Moreover, in the future, I don’t need to cross the finger, hoping my Javascript not to overeat anymore because my integration of Performance Budget on Github and CI will be the guardians for me.
Thanks for reading my articles all the way til here 😂! If you have any question or suggestion, please leave comments to let me know :D.
